
Income ETFs are having a moment. Covered call funds like JEPI got the headlines first (we covered why JEPI is king for dividend investors), but a second generation of option income funds has been quietly stacking assets with a different engine under the hood: credit spreads.
Instead of selling calls against the stocks they hold, these funds sell option spreads, collect the premium, and pass it through as monthly distributions. This post covers the put side of that trade: funds that sell put credit spreads and funds that sell cash secured puts. The headline numbers run roughly 5% to 10%. Those numbers are real, but what they represent varies a lot from fund to fund, and that is exactly what this post breaks down.
A credit spread is two options traded at once: you sell one option and buy a cheaper one further out of the money as protection. The gap between what you collect and what you pay is your credit. Max profit is the credit. Max loss is capped by the protective leg.
The Overlay Shares funds (the OV family) hold a plain index ETF like VOO or IJR and layer put credit spreads on the S&P 500 on top, recycling them roughly weekly. Because they are selling puts rather than calls, the equity upside stays uncapped, which is the big structural difference from covered call funds. The tradeoff: in a fast selloff the put spreads lose money at the same time the underlying index does.
The other put strategy in fund form is the cash secured put: sell a put, hold the full cash to buy the shares if assigned, collect the premium either way. WisdomTree's $PUTW is the institutional version, selling S&P 500 puts fully collateralized by Treasury bills, so the income stream is put premium stacked on top of T-bill yield. It is the same trade we teach in Cash Secured Puts 101, run at index scale.
| Ticker | Fund | Strategy | Distribution Rate | Trailing 12mo Yield | Expense |
|---|---|---|---|---|---|
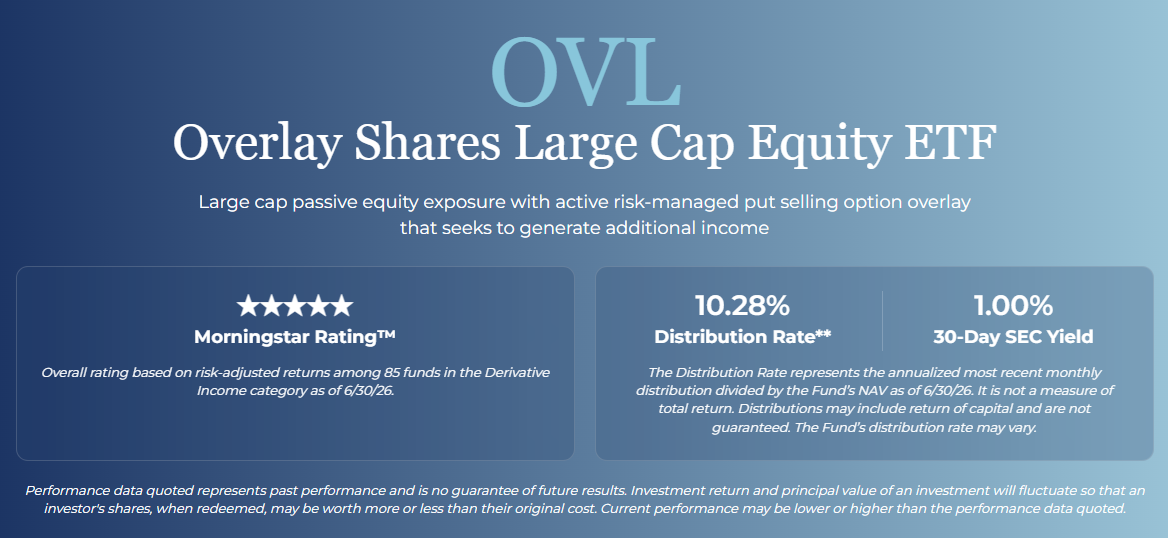
| $OVL | Overlay Shares Large Cap Equity | VOO + SPX put credit spreads, weekly recycle, upside uncapped | 10.28% (issuer, 100% ROC) | 6.5% | 0.79% |
| $OVS | Overlay Shares Small Cap | IJR + same overlay | 10% range (issuer, 100% ROC) | 6.7% | 0.83% |
| $OVF | Overlay Shares Foreign Equity | International equity + same overlay | 9 to 10% (issuer, 100% ROC) | 9.0% | 0.83% |
| $OVT | Overlay Shares Short Term Bond | Short bonds + overlay | n/a published | 7.1% | 0.79% |
| $OVB | Overlay Shares Core Bond | Core bonds + overlay | n/a published | 6.0% | 0.79% |
| $OVM | Overlay Shares Municipal Bond | Munis + overlay | n/a published | 5.3% | 0.81% |
| $PUTW | WisdomTree PutWrite Strategy | Sells S&P 500 puts, fully cash secured by T-bills | Varies monthly (issuer) | T-bill + put premium | 0.44% |
Distribution and yield figures are approximate, sourced from issuer fund pages and fund data providers as of mid 2026 (OVL distribution rate as of 6/30/26 per the issuer page shown above). These numbers change monthly. Always verify current figures on the issuer site before making any decision.
1. The OVL family's distributions are currently classified 100% return of capital. That means the monthly payout is not being generated as income in the tax sense. The issuer discloses this on every fund page, along with the line that the distribution rate "is not a measure of total return." You can see it in the screenshot above: 10.28% distribution rate sitting right next to a 1.00% 30-day SEC yield. Both numbers are true. They measure completely different things.
2. Put selling loses money fastest exactly when the market breaks. The put credit spreads that fund these distributions get hit at the same moment the underlying index falls. In a fast selloff, both layers of the fund draw down together. The protective legs cap the option loss, but this is not downside protection, it is income with equity risk attached.
3. These numbers go stale fast. Distribution rates on all of these funds reset monthly. Whatever you read here, check the issuer page for the current figure and its as-of date before acting.
This is our opinion and observation only, not a recommendation of any fund for any person. What we find notable: the OV family keeps upside uncapped, a structural difference from covered call funds that sell their upside away, and one that has historically shown up most in bull markets. The bond versions (OVT, OVB, OVM) behave like a bond ladder with an option kicker layered on top.
PUTW is structurally the purist's version of the trade: the same cash secured put mechanics retail options sellers run every week, executed at index scale with Treasury collateral. No leverage tricks, low expense, and the payout floats with rates plus option premium. Put selling strategies have historically lagged in strong bull markets, and that tradeoff is inherent to the design.
What none of these are: a free lunch. A 10% distribution with a 1% SEC yield is not 10% income. It is a cash flow schedule wrapped around a market strategy, and the market strategy can lose money. Whether any of that belongs in a portfolio is a decision for each investor and their advisor, not for a blog.
Credit spreads, covered calls, cash secured puts. Our analysts trade them live on Discord 9AM to 4PM Eastern every market day, with real entries and exits called out in real time.
Join ZTRADEZ Discord →